TASK 1 IELTS / PIE CHART: Please check my essay
The pie charts below show the average household expenditures in Japan and Malaysia in the year 2010.
Summarise the information by selecting and reporting the main features, and make comparisons where relevant.
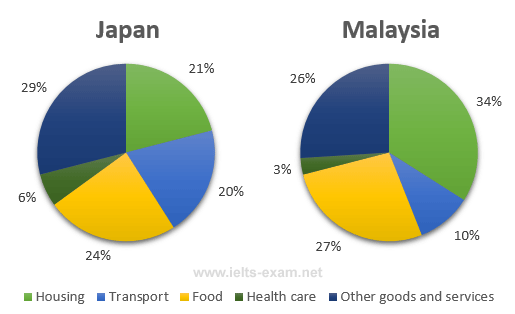
Given are the pie charts illustrating household spending of Japaneses and Malaysians in 2010.
Overall, both Japan and Malaysia’s citizens spent most of their money on Food and Housing. On the other hand, the proportions of expense for transport and health care were the smallest in both countries.
In Malaysia, while housing expenditure was ranked first with well over a third, that of Japan was only 21%. The average amount of money spent on food in Malaysia was 27%, 3% higher than in Japan despite this category accounting for the largest proportion of expenditure in this country.
In regard to the other categories, both Transport and Health care had the same rank in Japan and Malaysia. Compared to the expenditure on transport in Malaysia, which was only a tenth, Japanese spent twice as much of that. In contrast, in Japan, spending on Health care made up 6%, while that of Malaysia comprised only half of that figure. The other, unspecified, goods and services took up 29% and 26% in Japan and Malaysia, respectively.
Top answer
o Võ illustrating I gave you this advice on an earlier essay. Illustrate means "make a picture of". Use this verb for figures that are pictures - maps, diagrams, and process flows.
Get the Weekly English Kit 📬
New words, one handy idiom, and a 2-minute quiz — delivered to your inbox to keep your streak alive.
Ng?c B?o Võillustrating
I gave you this advice on an earlier essay.
Illustrate means "make a picture of". Use this verb for figures that are pictures - maps, diagrams, and process flows.
It is not a good choice for plots, charts, graphs and tables.
Use one of these as appropriate: compares, gives, shows, plots, or present
 0
0Given are the pie charts illustrating household spending of Japaneses and Malaysians in 2010. Read my previous post on the sentence.
Overall, both Japan and Malaysia’s
0