PLS!!! Help me by checking my task 1 _ Urban population
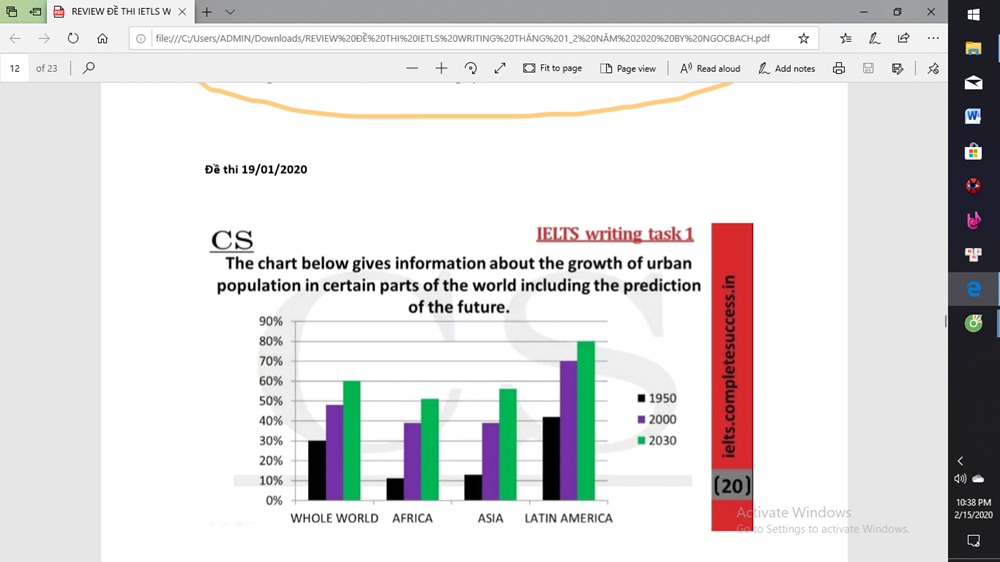
Topic: The chart below gives information about the growth of urban population in certain parts of the world including the prediction of the future.
My task 1:
The bar chart compares the increase of urban population in Africa, Asia, Latin America, and the whole world in 1950, 2000 and the projected growth by 2030.
Overall, there was an increase in the proportion of the population in Africa, Asia, Latin America and the whole world in 1950 and 2000. It is anticipated that three regions and the whole world will rise in 2030.
In 1950, the proportion of the population in Latin America was about 41%. After five decades, it increased by 30% and is expected to rise, by 80% in 2030. Similarly, the percentage of urban dwellers in the whole world was 30%. After a decrease in 2000, it is anticipated an increase to 60% in 2030.
The proportion of the population in Africa and Asia was approximately 11% and 12% respectively. In 2000, both Africa and Asia were 39%. Finally, by 2030, it is expected to rise, by 51% in Africa and 58% in Asia.
Top answer
The bar chart compares the increase of in the urban population in Africa, Asia, Latin America, and the whole world in 1950, 2000 and the provides projected growth by out to 2030. Overall, there was an increase in the proportion of the urban population s in Africa, Asia, Latin America and the whole worl d, in 1950 and 2000. and i t is anticipated that three regions and the whole world will rise in this trend will continue over the next decade.
Get the Weekly English Kit 📬
New words, one handy idiom, and a 2-minute quiz — delivered to your inbox to keep your streak alive.
The bar chart compares the increase of in the urban population in Africa, Asia, Latin America, and the whole world in 1950, 2000 and the provides projected growth by out to 2030.
Overall, there was an increase in the pro
 0
0