IELTS Writing Task 1
The given bar chart shows data regarding the proportion of Internet users, which is classified in different age groups in 3 years 1998, 1999 and 2000.
Overall, figures for all age groups saw similar trends in measured years. In addition, the 16-30 age group is the greatest percentage compared to the others.
Looking at the chart in more detail, it can be seen that the senior group and the adolescent group witnessed a non-stop increase over the period. There was a slight increase of nearly 6% and 4% in 1999, respectively. Moreover, although these two groups reached a new peak in the last year, the proportion of the 16-30 and 31-50 age group still accounted for the bigger number of users.
Between the two largest age groups, 16-30 and 31-50, experienced a decline in measured periods. Starting at nearly 53%, the 16-30 age group fell over by 8% in 2000 compared to 3% of the 31-50 age group in 2000.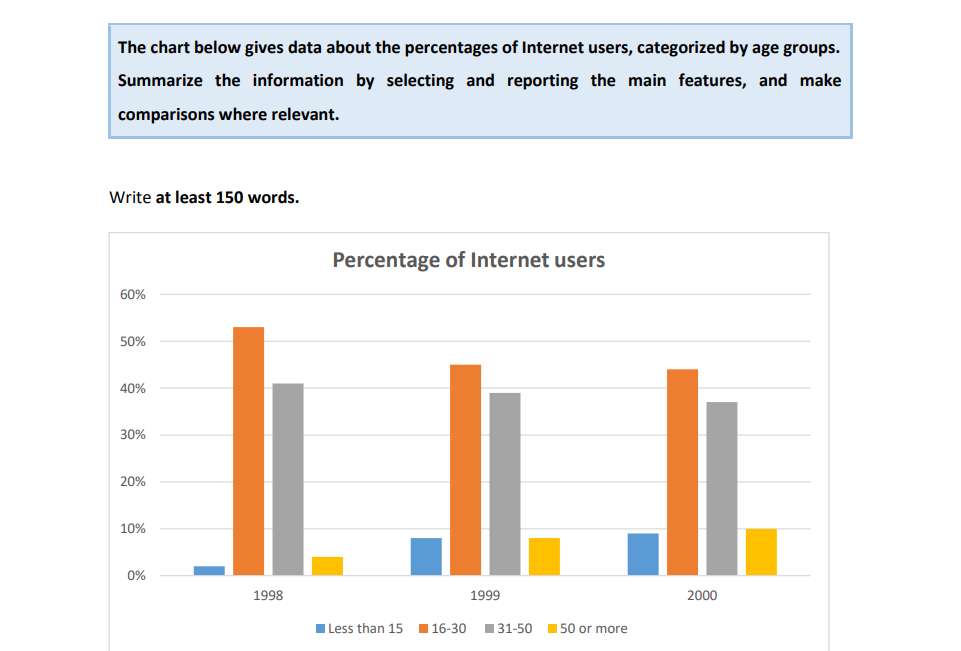
Top answer
) bar chart shows data regarding the proportion of Internet users, which is (wrong verb form) classified in into different (How many? ) age groups in 3 for three years : 1998, 1999 and 2000. ) similar trends in measured (wrong word.
Get the Weekly English Kit 📬
New words, one handy idiom, and a 2-minute quiz — delivered to your inbox to keep your streak alive.
The given (It is unnatural English to use "given" .) bar chart shows data regarding the proportion of Internet users, which is (wrong verb form) classified in into differe
 0
0